Carbon Data
Visualisation
Visualising your carbon data is essential for effective carbon accounting and reducing your business carbon emissions. Our graphing and analysis tools at carbonfit offer a comprehensive suite of features designed to provide deep insights into your carbon data. Our tools provide the clear actionable insights needed for effective carbon accounting, allowing you to reduce your business carbon emissions strategically.

Your Carbon Data.
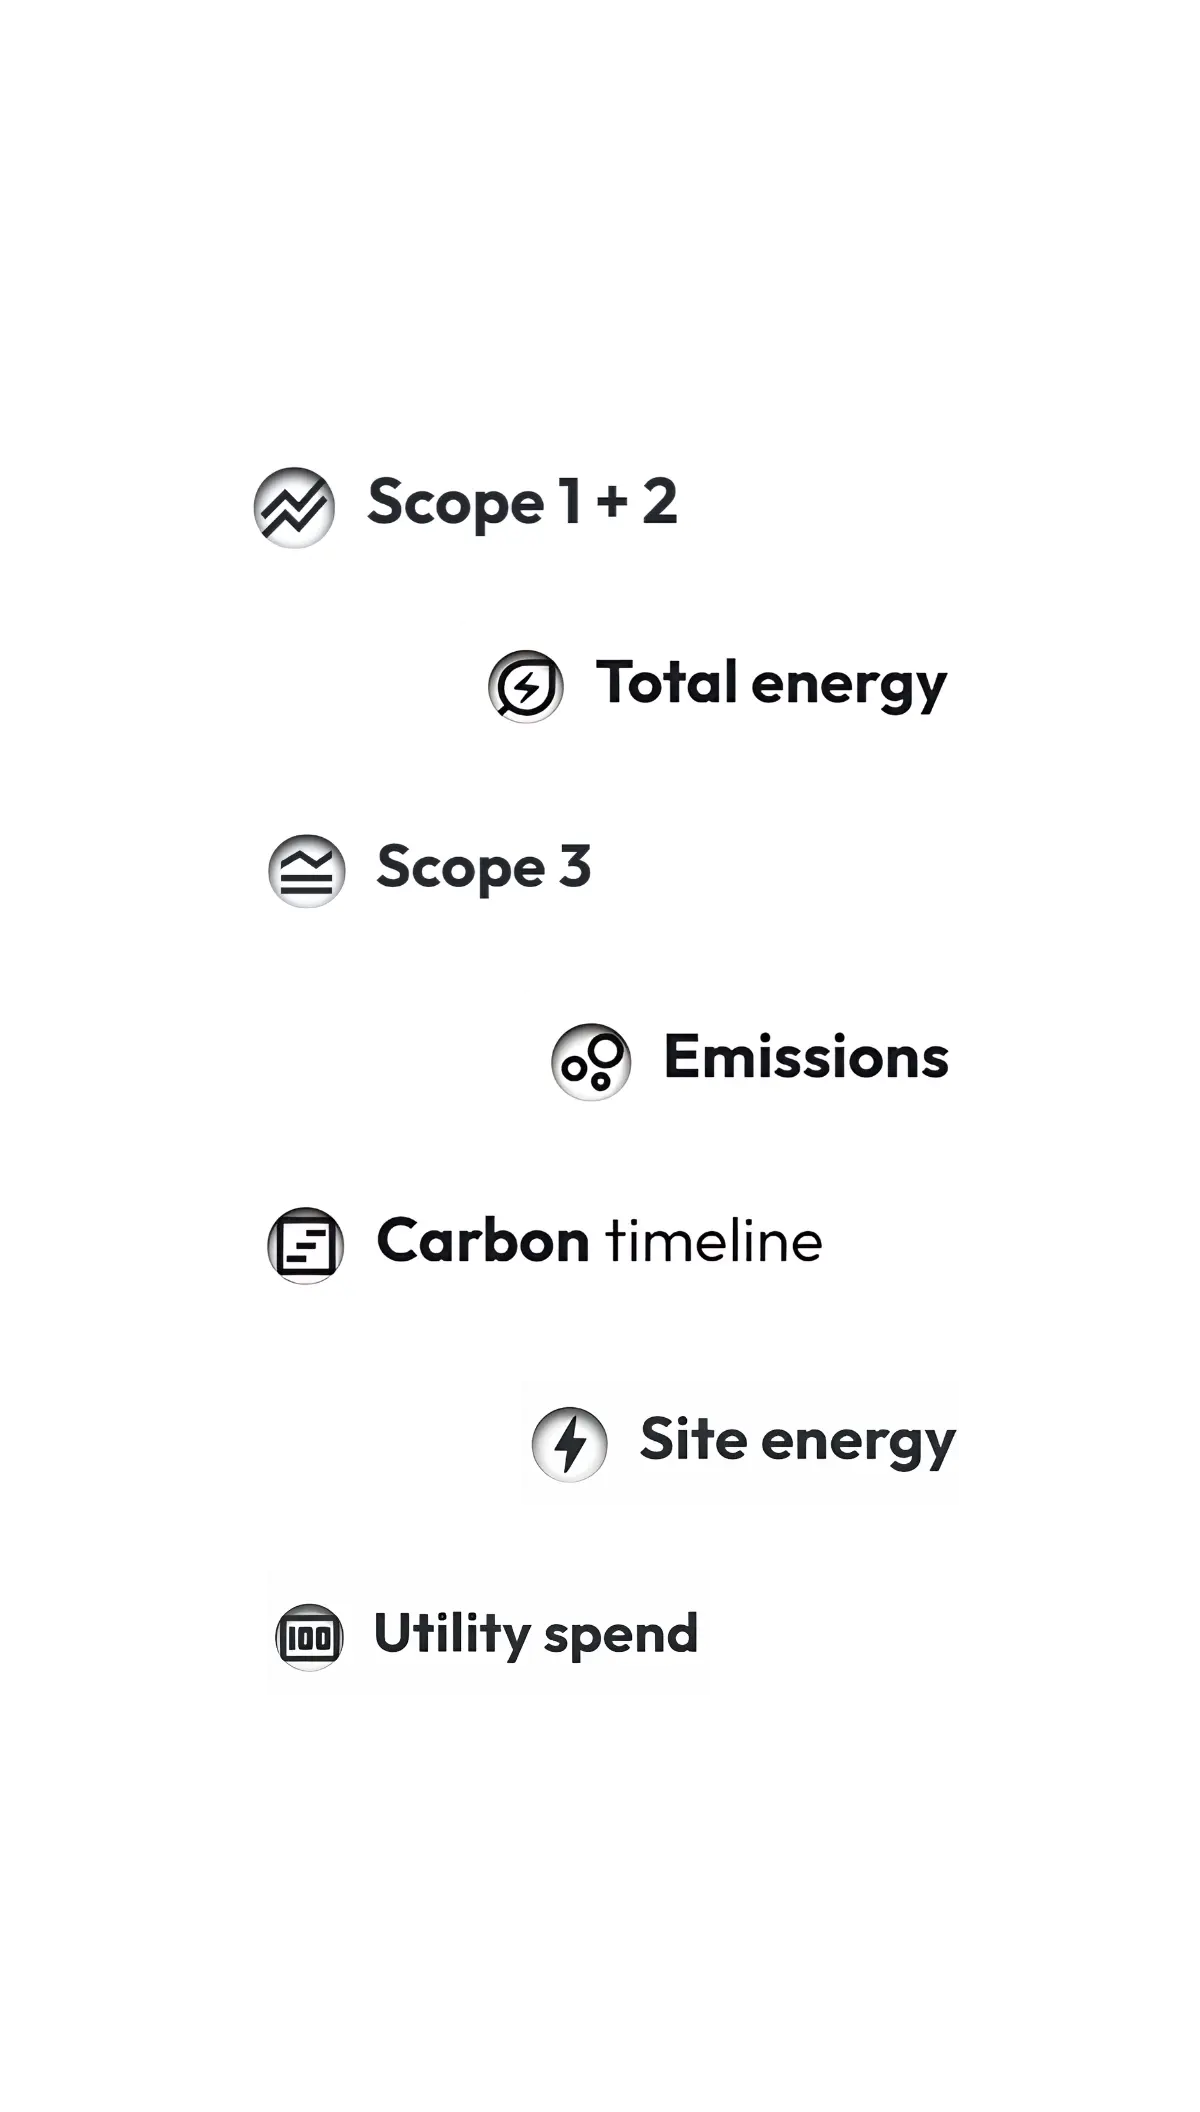
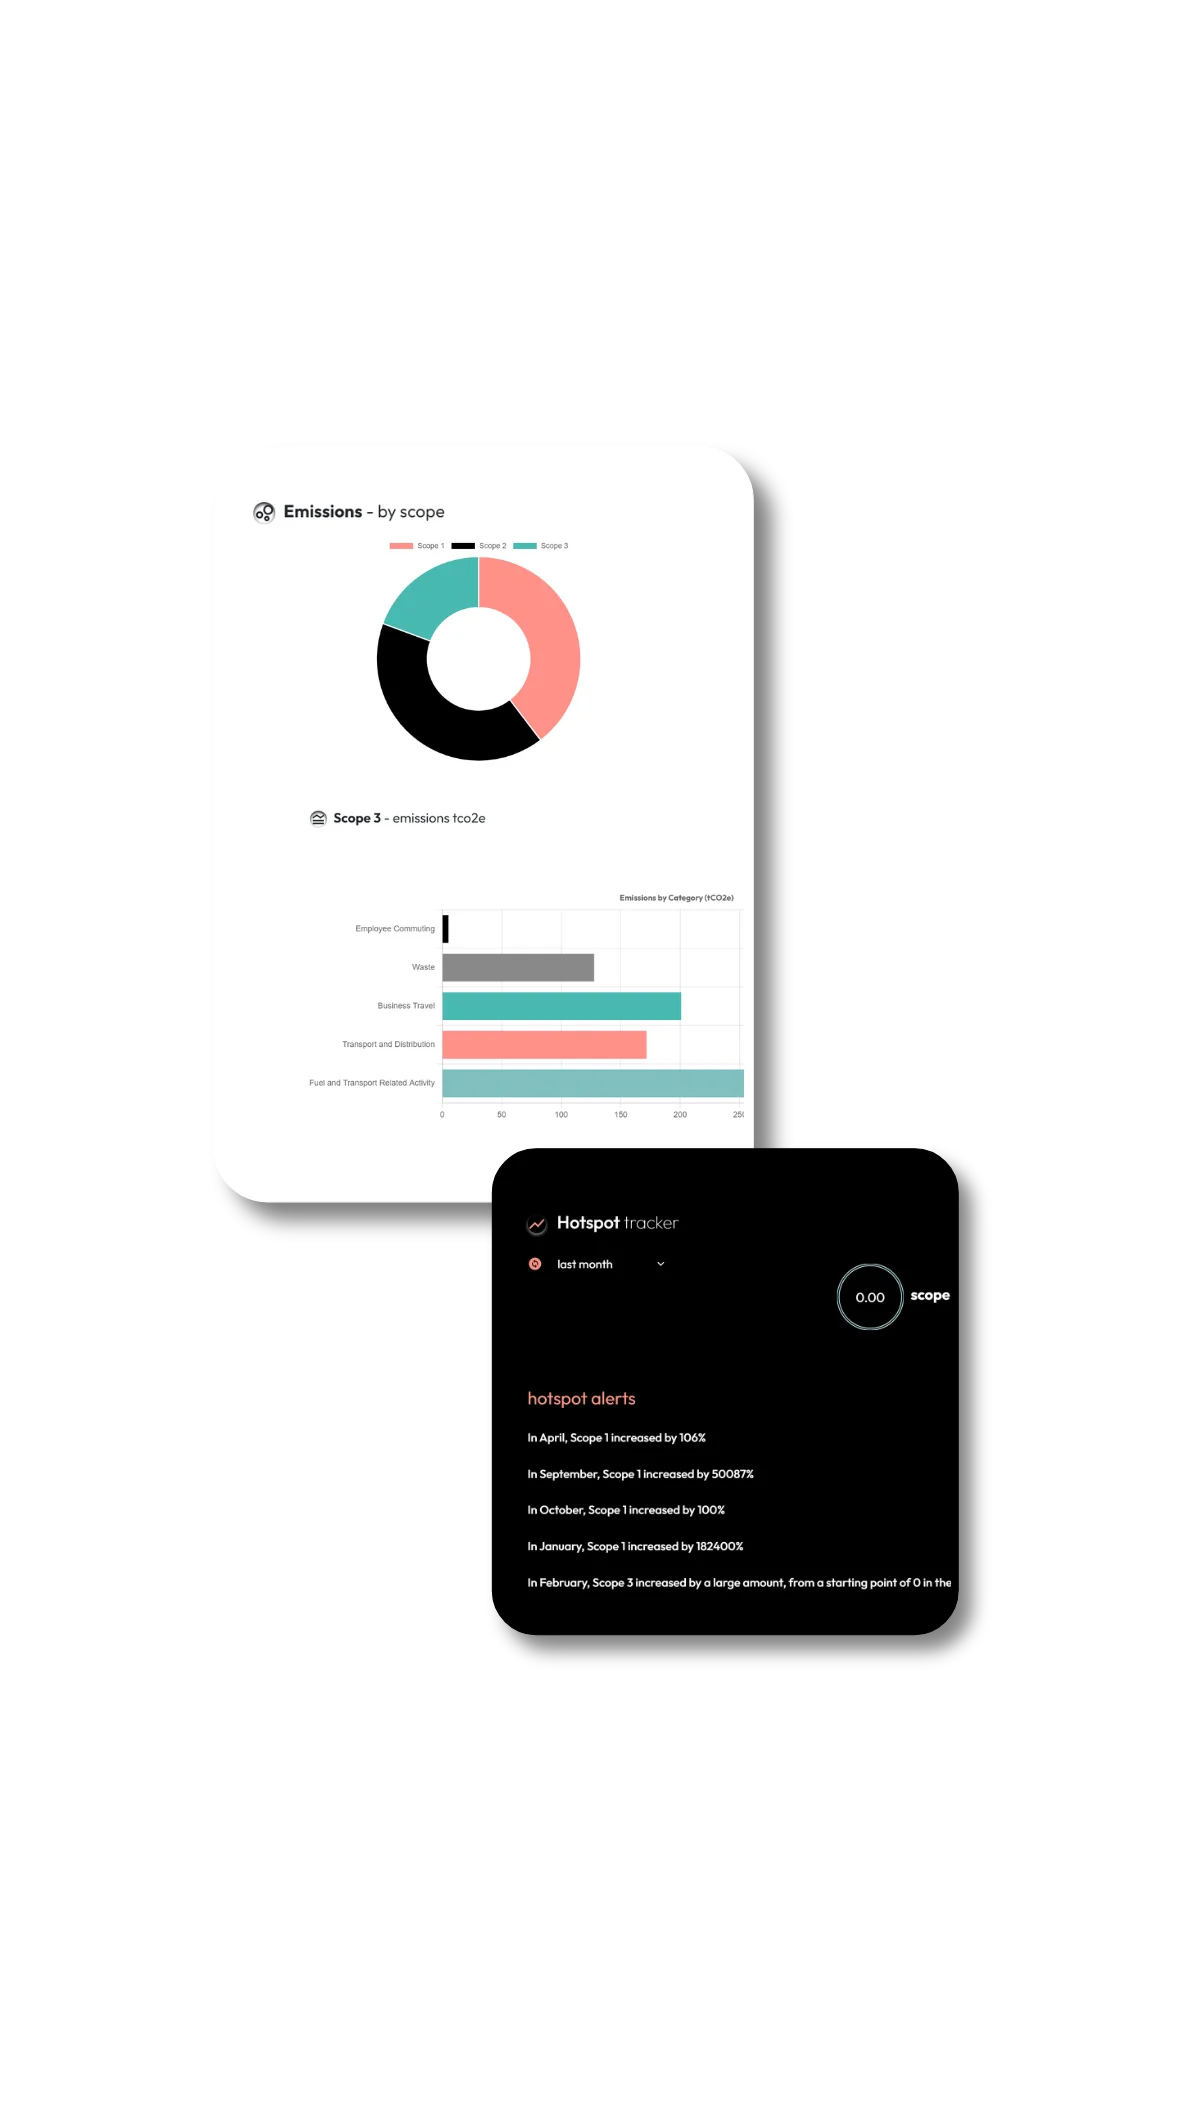
Visualising your carbon data is essential for effective carbon accounting and reducing your business carbon emissions. carbonfit’s Graphing and Analysis tools transform complex data sets into clear, easy-to-understand visuals, enabling you to make informed decisions quickly and confidently. Our graphing and analysis tools at carbonfit offer a comprehensive suite of features designed to provide deep insights into your carbon data. With our platform, you can track utility usage and create comparative graphs year on year, or for custom time ranges, allowing you to see trends and patterns over any period you choose. Perform site-by-site comparisons with ease, and switch from reporting year to base year with a simple click of a button. You can view detailed metrics such as kWh or TCO2e for each site and get a thorough breakdown of emissions across Scopes 1, 2, and 3. These features enable you to identify areas for improvement, track the effectiveness of your sustainability initiatives, and make informed decisions to reduce your business carbon emissions. Our intuitive graphing capabilities allow you to see trends, patterns, and anomalies in your data at a glance. By presenting your carbon footprint, energy usage, and other critical metrics in a visual format, you can identify areas that require attention and measure the impact of your sustainability initiatives more effectively.
Benefits Beyond Convenience.
The benefits of visualising your data extend beyond mere convenience. It enhances your ability to communicate your carbon management strategy to stakeholders, making it easier to gain buy-in and support for your initiatives. Additionally, visual data representations can highlight progress towards your sustainability goals, helping to motivate your team and demonstrate your commitment to environmental responsibility.


Empowering Stakeholder Communication.
Effective communication of your carbon management strategy is crucial for gaining stakeholder support. With carbonfit’s visual tools, you can present your data in a compelling way that underscores your efforts to reduce your business carbon emissions. This transparency not only builds trust but also encourages further investment in your sustainability initiatives.
Taking Control of your Carbon emissions.
Unlock the power of your data with carbonfit’s Graphing and Analysis tools and take control of your sustainability efforts with confidence. Our tools provide the clear actionable insights needed for effective carbon accounting, allowing you to reduce your business carbon emissions strategically. By transforming complex data into actionable visuals, you can drive meaningful change and achieve your environmental goals more efficiently.
carbonfit?